The limitations of data make it impossible to know exactly what percentage of the UKs laws are made in the EU
Those who argue against Britain’s continued membership of the European Union frequently highlight the percentage of UK law which in some way originates with the European Parliament, with their opponents arguing that these numbers are overstated. In the recent TV debates between Nick Clegg and Nigel Farage, the two wrangled over the figure, with the former incorrectly citing House of Commons library research which said the figure was 7%, and the latter counter-claiming that the figure was 75%. Here, the author of the research Vaughne Miller argues that both were wide of the mark, with the true figure somewhere in between.
In a television debate on Europe in March 2014 between the UK Independence Party leader, Nigel Farage, and the Liberal Democrat leader and Deputy Prime Minister, Nick Clegg, the amount of UK legislation that originates in Europe was raised. Nick Clegg said that only 7% of UK legislation was based on EU law, citing as his source a 2010 House of Commons Library research paper on this subject. In the second of the two Farage-Clegg debates in April, Mr Clegg explained that the 7% figure was for UK primary legislation implementing EU law and that 14% of UK Statutory Instruments (SIs) were derived from EU law.
Nigel Farage, on the other hand, said the overall total was 75%.
Who is right?
In short, neither of them is right and the actual figure is probably somewhere between the two. Although the vast majority of EU legislation is implemented by SI in the UK, and the number of EU-based SIs as a proportion of all UK SIs can be calculated, as the research paper points out, for a number of reasons it is impossible to achieve an accurate measure of the number of EU laws that are implemented in the UK or their overall impact.
What is wrong with Nick Clegg’s assertion?
Nick Clegg has given the figures of 7% and 14% of UK primary and secondary legislation (SIs) implementing EU directives and decisions. However, as the research paper points out, a more accurate estimate should also take into account the number of EU regulations, which can be several times higher than the number of directives or decisions.
Where did Nigel Farage’s assertion come from?
This is unclear. One explanation is that Nigel Farage referred to the 75% flagged up by former EP President Hans Gert Pöttering as the percentage of EU legislation in which the European Parliament had a say under the co-decision procedure, mistaking it for an estimate of EU-based national legislation. Another explanation came from a BBC comment on the TV debate: UKIP used a 2005 German government study, which said the equivalent figure for Germany was 84%, and revised the figure downwards in light of the fact Britain didn’t join the single currency.
Updating the estimate
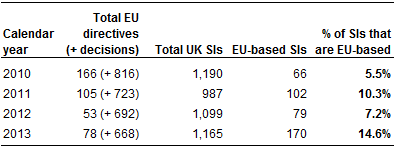
According to our parliamentary search records, the following numbers of SIs (made under either the European Communities Act 1972 or another parent act) implemented EU directives and decisions between 1 January 2011 and 31 December 2013 (the numbers of EU decisions are given in brackets; they may be addressed to individuals, rather than Member States):

The average over these four years was 9.4%.
Improving the estimate
Regulations are not supposed to require further national implementing measures, so there may be no way of linking them to domestic measures or factoring them into the equation. However, using the formula:
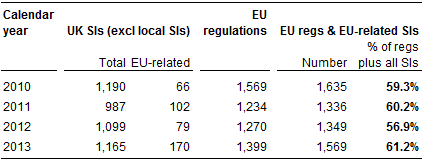
it is possible to estimate somewhat more accurately the proportion that EU regulations and EU-related UK laws form out of the total volume of UK laws, including all EU regulations, regardless of how or whether they are formally implemented.
From 1997 to 2009, according to Library calculations based on the above formula, the average percentage of EU-based UK measures was 47% (see table on page 24 of research paper). The figures for 2010 to 2013 are as follows:
The average over these four years was higher, at 59%. But even this calculation does not take account of UK primary legislation or EU ‘soft law’ such as statements, recommendations, guidelines, declarations, special reports etc, which may be implemented equally ‘softly’ in the UK.
As for primary legislation over this period, while around 40% of some 93 UK Acts of Parliament had an EU context of some sort (mostly in references to terminology or to earlier EU acts), only three exclusively implemented EU law.
Conclusion
All measurements have their problems and it is possible to justify any measure between 15% and 55% or thereabouts, depending on what is included in or excluded from the calculation. To exclude EU regulations from the calculation is likely to give an underestimate (see table on page 20 of research paper), while to include all EU regulations will probably give an overestimate (see table above).
The answer in numerical terms lies somewhere in between the two approaches, but the limitations of data make it impossible to achieve an accurate measure. We do not know, for example, how many regulations have direct application in the UK – olive and tobacco growing regulations are unlikely to have much impact here, but the UK implements such regulations along with olive and tobacco-growing Member States. The possibility of this happening increases as the EU expands to include more, and more diverse, Member States.
—
This piece was originally published on the House of Commons Library blog ‘Second Reading’, under the title ‘How much legislation comes from Europe?’
Please read our comments policy before posting. The shortened URL for this post is: https://buff.ly/1h4tVCS
—
Vaughne Williams is a Research Analyst at the House of Commons Library


 Democratic Audit's core funding is provided by the Joseph Rowntree Charitable Trust. Additional funding is provided by the London School of Economics.
V interesting RT “@democraticaudit Why Nick and Nigel are both wrong about the role of the EU in UK legislation https://t.co/1hKZKZxDQW“
Why Nick and Nigel are both wrong about the role of the EU in UK legislation https://t.co/tGyQQy4tVJ
Sulla possibilità di stabilire l’impatto della UE sulla legislazione nazionale via @democraticaudit https://t.co/NApOfFQZ0b
‘The limitations of data make it impossible to know exactly what percentage of the UKs laws are made in the EU’ https://t.co/mHvLxpZ8et
Impossible to know what percentage of UKs law made in EU, says report https://t.co/od7JQXCn29 by @democraticaudit That settles that then..
Clegg versus Farage: who was right on the impact of EU law? House of Commons library tries to answer -> https://t.co/Nx1CbX8Cm0
Farage and Clegg are both wrong about the percentage of UK law made in Brussels https://t.co/yQUjJtDhyo
7%? 70%? Finding out how much of national law is EU law is harder to find out, according to @commonslibrary: https://t.co/putLZMtodL
The limitations of data make it impossible to know exactly what percentage of the UKs laws are made in the EU https://t.co/Hf0Taz9V9D
The limitations of data make it impossible to know exactly what percentage of the UKs laws are made in the EU https://t.co/q56eqClNeu