Voters react to ethnic minority candidates in different and sometimes unexpected ways
The number of ethnic minority MPs and parliamentary candidates is on the rise – despite this, numbers are still disappointingly low, as is the case in many influential sectors in the UK. Here, Josh Zinger and Benjamin D. Farrer share research which shows that voters react to ethnic minority candidates differently depending on their own ethnicity, and that of the candidate.
How does the representation of ethnic and racial minorities matter? Criticism of ‘whitewashing,’ (the systematic under-representation of ethnic and racial minorities in popular culture) is becoming increasingly common, but what about in politics? People from ethnic minority backgrounds are badly under-represented in Britain. They make up 14% of the population, but only 3.7% of the top ranks of the civil service, 8.3% of the senior positions at FTSE100 companies, and 6.3% of MPs. Other examples of under-representation abound, including academia, law, journalism, and sports. Britain is not unique in how people from ethnic minority backgrounds remain absent from the most high-profile professions.
For elected officials, this absence could be crucial. If ethnic minority voices are absent from the policy-making process, then this could end up having an impact on many different parts of society. Tracing those impacts, though, is extremely hard. In the media, Oscar-winner Lupita Nyong’o said that descriptive representation of black women in films was extremely important to her: “My world exploded by them being on screen“. Are there similar effects in politics? How do different types of voters react to ethnic minority candidates? That is the question we answer in a forthcoming article in Party Politics: “The electoral effects of the descriptive representation of ethnic minority groups in Australia and the UK”.
Our Evidence
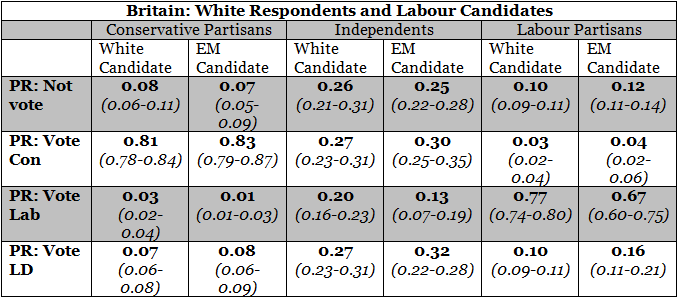
We use public opinion surveys from Britain (spanning 7 parliamentary elections 1983-2010) and Australia (spanning 3 federal parliamentary elections 2004-2010), which ask about the ethnic backgrounds of respondents, and about their voting behaviour. We build a statistical model and then assess how the presence of an ethnic minority candidate affects both ethnic majority and ethnic minority voting behaviour. We assess what happens to vote choice in all the possible permutations of candidates, parties, and voters. For example, if we take all our survey responses, take the average voter (that is, someone whose age and gender match the means of the sample), and assume that they are white and that they’re choosing between a white Labour candidate and a white Conservative candidate, we find that they have about a 27% chance of voting Conservative, a 20% chance of voting Labour, and a 20% of not turning out to vote at all. Those numbers change to 81%, 3%, and 8% respectively if the person identifies as a Conservative, and 3%, 77%, and 10% respectively if the person identifies with Labour. Those are the averages, using all the survey data from 1983-2010.
Now, we can work out all our different permutations. The tables below show what happens when white voters are confronted with different types of Labour candidates. First we show how Conservative white partisans react, then independents, and then Labour partisans. As we show, white Labour supporters react to ethnic minority candidates negatively – support goes down by about 10 percentage points. Your average white Labour candidate gets about 77% of their white base of partisans. Ethnic minority Labour candidates can only rely on 67%.
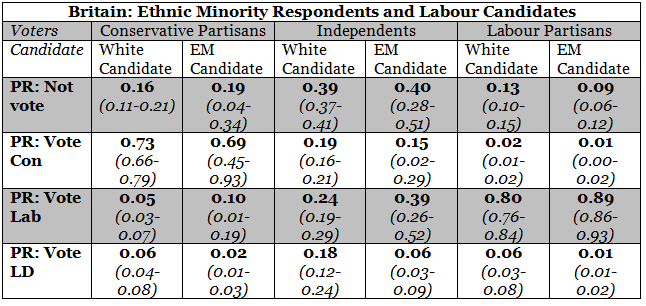
Next, take a look at ethnic minority voters. An average white Labour candidate can count on winning 80% of the vote from ethnic minority Labour partisans, but an ethnic minority candidate can get 89% support from the same group.
There are lots of other interesting comparisons to make here. For example, there is no evidence the white Conservative base reacts negatively to ethnic minority Labour candidates: support does not increase above its usual 80% level. Nor do ethnic minority Conservative voters switch to Labour if Labour runs an ethnic minority candidate: support goes from 75% to 69% but there are so few ethnic minority Conservatives that we cannot be sure about this result.
That brings us to a good final point: many questions remain. For example, after the election of 2015, Labour might feel more threatened by UKIP and so might shift their strategies to avoid an increased backlash. But the numbers above allow us to get a handle on these questions. We can imagine parties strategising over which candidates should be selected for which safe seats: is the ethnic minority population in the constituency large enough, and partisan enough, that the expected 10-point bump amongst those voters will outweigh the expected 10-point backlash amongst white voters?
—
Note: this post represents the views of the author, and not those of Democratic Audit or the LSE. Please read our comments policy before posting.
—
Josh Zingher is an assistant professor of political science at Old Dominion University, where he teaches classes on American politics, political behaviour, and research methodology and statistics.
Benjamin D. Farrer is an Assistant Professor at Knox College


 Democratic Audit's core funding is provided by the Joseph Rowntree Charitable Trust. Additional funding is provided by the London School of Economics.
Voters react to ethnic minority candidates in different and sometimes unexpected ways https://t.co/MqKpI6XjPq
Voters react to ethnic minority candidates in different and sometimes unexpected ways https://t.co/Tuv2spsj0L #Option2Spoil
Voters react to ethnic minority candidates in different and sometimes unexpected ways https://t.co/s1qU2U2DUq https://t.co/9bpXBnmb4l