The 2015 election has been described as the most disproportional ever – but it wasn’t disproportional everywhere
Disproportionality is the degree of mismatch between parties’ shares of votes and their shares of seats, with measures of disproportionality usually calculated for national elections. This year’s general election was criticised by many as the least proportional ever. Chris Hanretty acknowledges that on some measures, this is a valid claim, but demonstrates that calculating a measure for local disproportionality gives a better sense of how the mismatch varied across England, Scotland and Wales.

Statue of a mariner in Sittingbourne. Credit: Matt Brown CC BY 2.0
The 2015 election has a good claim to be the most disproportional general election ever – at least on some measures. Some parties (like the SNP) won a far higher share of seats than they did votes. For other parties, the reverse is true. UKIP won ten percent of the vote in Great Britain, but only won one of six hundred and thirty two seats, or less than a quarter of one percent.
Usually when we talk about electoral disproportionality, we talk about disproportionality at the national level. But there’s no bar to calculating disproportionality for particular groups of seats – even groups that vary across constituencies. I spend most of my time in Norwich South. I am therefore more interested in the twenty constituencies closest to me. By using the figures for these constituencies alone, I can calculate a measure of local disproportionality for Norwich South. By repeating this exercise for other seats, I can calculate local disproportionality across the country.
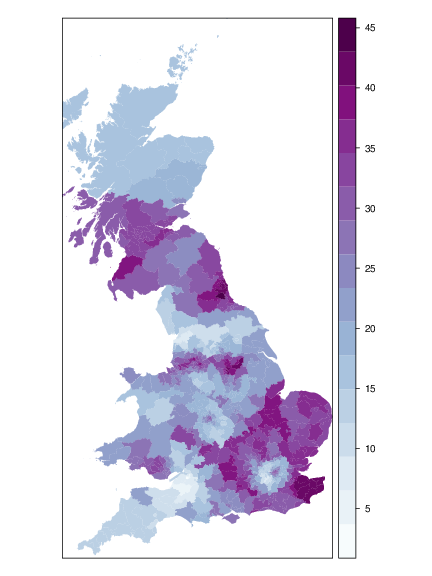
Two years ago on this blog, I did just that. For each seat, I took the 2010 results from the twenty closest constituencies, and calculated the Gallagher index of disproportionality (although the results that follow are very similar if one calculates the Loosemore-Hanby or Sainte-Laguë indices instead of the Gallagher index: the correlation between these measures is very high at r > 0.98). I found that the City of Durham was the worst constituency for local disproportionality since, in that seat and others around it, the votes which went to parties other than Labour were wasted votes. Local disproportionality was also high in Kent, though for different reasons.

Figure 1: Local disproportionality in 2010. Higher values (darker colours) indicate greater disproportionality.
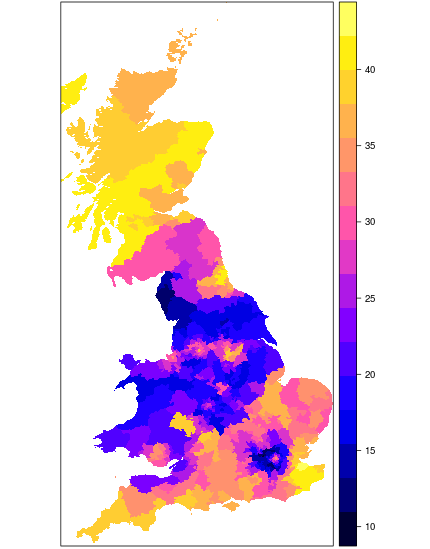
The picture in 2015 (shown below) is subtly different. City of Durham is still one of the worst constituencies for local disproportionality, for the same reasons as in 2010. Yet it is no longer the worst constituency in the country. That honour goes to Sittingbourne and Sheppey in south-east England. When we look at the twenty constituencies surrounding Sittingbourne, we find a large number of wasted votes for UKIP, not to mention Labour and the Liberal Democrats. The situation is similar in the next-worst constituencies – Dover, Canterbury, and Folkestone and Hythe – which are also located in Kent, and which show up on the map in bright yellow.

Figure 2: Local disproportionality in 2015. Higher values (lighter colours) indicate greater disproportionality.
Although they do not score as highly, constituencies in the South West also have high levels of local disproportionality – in part because of a large number of wasted votes for UKIP, but more because of the failure of the Liberal Democrats in what was previously a successful hunting ground.
Another area of high local disproportionality can be found in Scotland. Many Scottish constituencies had high local disproportionality in 2010, but for very different reasons. Then, the disproportionality existed because Labour won the lion’s share of seats on narrow pluralities. In 2015, the disproportionality exists because the SNP routed its opposition, winning all but three Scottish seats (95%) on 50% of the vote.
By contrast, voters in outer London and the Midlands do well: voters in these areas who look at the local political map will see a relatively proportional translation of votes into seats.
Why does any of this matter? People’s sense of political efficacy – their sense that the political system is responsive to people like them – depends on many factors. One of these factors is the overall disproportionality of the electoral system. Thus, self-reported efficacy is higher in countries which use proportional representation.
I don’t want to suggest that voters calculate measures of local disproportionality before forming beliefs about their own political efficacy. But in thinking about their own efficacy, they might look at their local area, and form judgements on that basis. There are therefore good reasons for thinking that voters in some of the areas highlighted in the above figure – Kent, the south-west, Scotland and parts of north-east of England – will be disproportionately dissatisfied with how the political system as a whole operates.
—
Note: this post represents the views of the author and not those of Democratic Audit UK or the LSE. Please read our comments policy before posting.
—
 Dr Chris Hanretty is a Reader at the University of East Anglia


 Democratic Audit's core funding is provided by the Joseph Rowntree Charitable Trust. Additional funding is provided by the London School of Economics.
[…] Sources: Chris Hanretty […]
[…] This article was originally posted on Democratic Audit UK and it gives the views of the author, and not the position of EUROPP – European Politics and […]
[…] https://www.democraticaudit.com/?p=183601 […]
The 2015 election has been described as the most disproportional ever – but it wasn’t disproportional everywhere https://t.co/eZu9ZvFrbz
The 2015 election has been described as the most disproportional ever – but it wasn’t disproportional everywhere https://t.co/iVdt4NkK2Z
Fascinating stuff from @chrishanretty on regional variation in electoral disproportionality in #GE2015 https://t.co/kUkt9BjwNY
The UK 2015 election was very disproportional, but not equally so everywhere https://t.co/tgWu8jlfpj
I don’t really see how looking at neighbouring constituencies really helps indicate how proportionately I am represented. My constituency has been Conservative for more than 90 years. If I have a concern that “fits” the Conservative programme I might find that my representative vigorously pursues my concern. But if it does not fit my representation is probably limited to “my concern being passed on to the relevant ministry”.
Now in my 8 neighbouring constituencies I have
1 SNP
2 more Conservatives
5 Labour
and by looking at their 16 neighbouring constituencies I have:
1 Liberal!
2 more SNP
3 more Conservatives
10 more Labour
But what good is that? They will only represent their own constituents!
And isn’t the analysis distorted by people modifying the voting/ non-voting behaviour in the light of First Past the Post?
3rd and 4th party voters either
– not voting, or
– tactically voting
1st party voters not turning out because “their vote is not needed”.
It does not even give a particularly good indication of how proportionate things might be with multi-member constituencies (under say STV) – which would be interesting to know – because this analysis only approximates to leading first preferences.
The 2015 election has been described as the most disproportional ever – but it wasn’t disproportional everywhere https://t.co/NWNKidVpNZ
[…] https://www.democraticaudit.com/?p=18360 […]
The 2015 election has been described as the most disproportional ever – but it wasn’t disproportional everywhere https://t.co/tgWu8jlfpj
The 2015 election has been described as the most disproportional ever – but it wasn’t… https://t.co/Ret55PNHXW https://t.co/H0a9JN0YUm