Just how special are special advisers within the UK civil service?
Using the most recent government data, Sir Richard Mottram (LSE) discusses what we know about special advisers, and specifically what we know about their pay. He argues that more light needs to be shed both on the system and the government’s narrative about it.

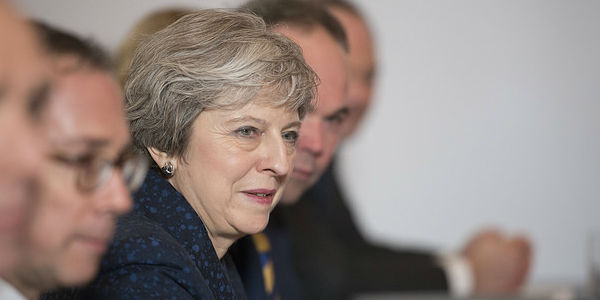
Theresa May meets Macron at Sandhurst, accompanied by Chief of Staff Gavin Barwell (who replaced Nick Timothy and Fiona Hill), January 2018. Picture: Number 10, via (CC BY-NC-SA 2.0)
As the Prime Minister shuffled her Ministerial pack in January 2018, it was not only her Ministers who were at risk. For those Ministers who are members of, or attend, the Cabinet, their fate also determined that of their special advisers, who serve at the Prime Minister’s pleasure and for the duration in office of the Minister whom they advise and personally champion.
The ins and outs of special advisers rarely attract much public attention. Individual advisers have been involved in one or two quite spectacular disasters at departmental level and within Number 10, as witnessed by the departure of Nick Timothy and Fiona Hill, the Prime Minister’s ultra-powerful joint Chiefs of Staff. But to gauge what is happening as a whole the interested observer has to rely on an annual publication issued each year in the run-up to Christmas.
The Cabinet Office publishes annually the list of the names and pay of special advisers in post in December, and thereby total numbers and pay-related costs. The 2017 publication shows that, in comparison with 2016, numbers were marginally down – from 89 to 88 – and seem to have stabilized at around the 90 mark, so there was no big news there. Of the Prime Minister’s top ten special advisers in 2016, following the election only 3 made it to the end of 2017. In the case of the Chancellor of the Exchequer, 3 out of 5 have changed. So, even where the Minister has stayed in the same post, there has been plenty of churn.
For aficionados of the ways and workings of British government, the commentary introducing the numbers is also of interest. The brief introductory section purports to put the basic facts about numbers and costs into context. Like some other government pronouncements, each statement made is (roughly) true in itself but is the picture painted misleading rather than illuminating?
The Story
The December 2017 release reports that there are 88 specials advisers working “across the whole of government”. “By comparison the total civil service has 423,000 civil servants” and, in the same vein, “special advisers cost an estimated 0.05% of the total Civil Service pay bill.” Alongside the pay cost of £7.3 million in the financial year 2016/17 (and severance payments of £1.5 million), the 2017 release introduces a new benchmark: “By comparison, Opposition political parties received £11.5 million a year in state funding in 2016/17”. In other words perhaps the message is why are some commentators so obsessed with this minute element of the government machine whose cost is less than the money devoted to public support to the Opposition – what could be fairer than that? Does this narrative stand up to scrutiny?
88 versus 423,000
Clearly this comparison is true in terms of the numbers of individuals who are permanent civil servants with one type of employment contract and Code of Conduct and the very much smaller number who are temporary with a different contract and Code. But beyond this important legal point, are special advisers really to be compared with the generality of civil servants? The answer is clearly no, for a variety of reasons.
A missing comparison
As a first illustration, the data provided includes pay. So the “By comparison” commentary could have included the average salaries of the 88 compared with the 423,000. The median salary of a special adviser in December 2017 was £69,000 (or £72,000 for the subset who work for the Prime Minister). The median salary of the 423,000 civil servants (at March 2017) was £25,900. So special advisers are paid on average more than two and half times the average civil service salary. This is neither surprising nor shocking. Special advisers are part of a very small group of more senior advisers, including permanent civil servants, who work closely on policy and strategy in Whitehall. This is far removed from the generality of civil service roles, counted within the 423,000 number.
Disaggregating the 88
In most commentary on special adviser numbers, not enough attention is paid to the number of special advisers working for the Prime Minister compared with other Ministers. 32 out of 88 special advisers worked for the Prime Minister in December 2017 (there are more advisers now in Number 10 than under Mr. Blair, which may come as a surprise to some). A breakdown of the numbers of permanently-employed staff and special advisers working at the heart of government for the Prime Minister and other Cabinet Office-based Ministers can be found in the Cabinet Office’s Annual Report and Accounts for 2016/17 (see Table 2.3 on page 43). This identifies 480 staff excluding Ministers, of whom 33 are special advisers. So in this central role, 1 staff member in 15 is a special adviser. The ratio for those at the heart of the Number 10 operation in and around the private office would be still smaller.
£7.3 million versus £11.5 million
So is the comparison of special adviser costs (£7.3 million, excluding one-off severance) to Opposition support from public funds (£11.5 million) any more illuminating? (We might note in passing that the £11.5 million number is more than £1 million higher than figures published by the Electoral Commission). In one sense this is a relevant comparison because support for political advice to government and to the Opposition parties in Parliament are two sides of a coin. A number of people inside and outside parliament questioned the plans of the then Coalition government which, having increased special adviser numbers, proposed reductions in planned financial support for Opposition parties. So expenditure trends in these two numbers are important. But the coverage of the absolute numbers need to be unpacked if the underlying reality is to be understood.
First, we should have in mind that the £7.3 million figure leaves out the cost of the permanent civil service staff providing support to special advisers, and costs of IT support, accommodation, etc. Moreover the comparison is misleading in a much more fundamental way. In its own work on policy and strategy development the government can draw on the resources of the policy civil service alongside those of special advisers as the figures for the Cabinet Office quoted above illustrate. Unsurprisingly the £7.3 million figure captures only a limited element of the total policy and strategy effort available to government, which vastly outweighs, as one would expect, that available to Opposition parties.
More transparency, better comparisons
So what conclusions should we draw? We should welcome the transparency provided by the annual disclosure of the names of special adviser, their pay, and thereby total numbers and at least pay-related costs. Transparency could be further improved by disclosing the background and experience of each special adviser on appointment. Events over the last year particularly over the Prime Minister’s Joint Chiefs of Staff have reinforced the case for a more regulated system as the Better Government Initiative argues in its evidence to the PACAC Inquiry on Civil Service Effectiveness and Capacity. The merits or otherwise of the substantial increase in special adviser numbers over the last 20 years are contested territory. Public debate on this issue is not aided by the shallow commentary currently provided along with the annual disclosure of numbers.
This post represents the views of the author and not those of Democratic Audit. It was originally posted on the LSE British Politics and Policy blog.
 Sir Richard Mottram is a Visiting Professor in the LSE’s Department of Government and Chair of the Better Government Initiative.


 Democratic Audit's core funding is provided by the Joseph Rowntree Charitable Trust. Additional funding is provided by the London School of Economics.