How democratic are the reformed electoral systems used in Britain’s devolved governments and English mayoral elections?
As part of our 2018 Audit of UK Democracy, Patrick Dunleavy and the Democratic Audit team examine how well citizens are represented by the two main reformed electoral systems used in the UK – the ‘additional members system’ (AMS) and the ‘supplementary vote’ (SV). How successful have they been in showing the way for more modern electoral systems to work well under British political conditions?
 City Hall, London. Picture: Garry Knight, via a (CC BY 2.0) licence
What does democracy require for an electoral system?
- It should accurately translate parties’ votes into seats in the legislature (here, the Scottish Parliament, the Senned (or Welsh National Assembly) and the Greater London Assembly),
- Votes should be translated into seats in a way that is recognised as legitimate by most citizens (ideally almost all of them).
- No substantial part of the population should regard the result as illegitimate, nor suffer a consistent bias of the system ‘working against them’.
- When electing a single office-holder (like an executive mayor), the system should maximise the number of people who can contribute to the choice between candidates, and encourage office-seekers to ‘reach out’ beyond their own party’s supporters. Ideally single office holders should enjoy clear majority support, so as to enhance their legitimacy.
- If possible, the system should have beneficial effects for the good governance of the country.
- If possible, the voting system should enhance the social representativeness of the legislature, and encourage high levels of voting across all types of citizens.
Since 1997 voting systems in the UK have diversified. In its early years the first Blair government, acting with Liberal Democrat co-operation, created proportional additional member systems (AMS) for new devolved government institutions in Scotland, Wales and London. These had their fifth round of elections in May 2016.
Labour also created a second new electoral system, the ‘supplementary vote’ (SV) for choosing the London mayor (approved in a London-wide referendum and used successfully five times now). From 2010 to 2016 Conservative ministers in the two Cameron governments also encouraged introducing ‘strong mayor’ elections elsewhere, especially for new metropolitan/regional mayors (elected first in 2017 and 2018), further expanding the use of the SV system. However, in June 2017 the Conservative election manifesto proposed to replace all SV elections with plurality rule (first-past-the-post) voting. When the Tories failed to get a Commons majority, this proposal seemed to lapse.
Additional member systems in Scotland, Wales and London
Used for: choosing Members of the Scottish Parliament (MSPs), Assembly Members (AMs) in the Welsh National Assembly and members of the London Assembly (GLA).
How it works: In ‘classic’ versions of AMS (as used in Germany and New Zealand, and also known as a mixed-member proportional system) half of the members of these bodies are locally elected in constituencies using plurality rule or first-past-the-post (FPTP) voting. The remaining half (the ‘additional’ or ‘top-up’ members) are elected in larger regional areas, where a whole set of seats are allocated using a proportional representation system – so as to make parties’ overall seat shares match their vote shares as accurately as possible. Voters cast two ballots: one for their constituency representative, and one for a party to represent them at the top-up region level.
In ‘British AMS’, because constituency representation was seen as historically and culturally important in the UK, there are more local constituency seats than top-up seats (Figure 1). In Scotland and Wales the top-up areas are sub-regions. For the small London Assembly the top-up area is the whole of London. In Wales, the proportion of top-up representatives at sub-regional level is just a third of seats. This is sometimes too small to ensure proportional outcomes, if one party (so far always Labour) is heavily over-represented in winning constituency seats.
Figure 1: The proportion of constituency and top-up seats under AMS in British institutions

Voters get two ballot papers, one for party candidates for their local constituency and one for party slates of candidates for the wider regional contest. They mark one X vote on each paper. In the local constituencies, whoever gets the largest pile of votes (a plurality) is the winner (with no need to get a majority).
In AMS voters also have a second vote for their regional top-up members. To decide who gets top-up seats, each party puts forward a slate of candidates (their ‘list’), and voters choose one party to support. The election officials look at how many local seats a party already has within region A from the local contests, and what share of the list votes it has in the A region. If a given party already has its full share of seats, it gets none of the top-up members. But if the party does not have enough seats already it is assigned additional members, taken from its list of regional candidates, so as to bring each party as closely as possible to having equal percentages of seats and votes (for the top-up area stage). The order that parties place candidates in their lists is crucial, since it determines who of their people are elected at any given level of support.
There’s a formula for doing this that works near perfectly given large top-up areas. However, it may over-represent larger parties if a lot of the list vote is split across multiple smaller parties, which tends to happen quite a lot in British AMS elections.
Recent developments
A key rationale for the three AMS systems is to offer proportional representation for each of the bodies involved. In evaluating this claim it is worth bearing in mind as a benchmark the Westminster electoral system’s deviation from proportionality, which had averaged 22.5% in the two decades up to 2015 – but which fell spectacularly to under 10% in 2017 (see our Audit on FPTP). Compared with the historic Westminster outcome Figure 2 below shows that the Scottish AMS system has performed twice as well in terms of matching party seats shares with their vote shares, and the London system has fared almost as well. In Wales DV scores are higher, because there have been too few top-up seats, especially in 2007. But still, on average, DV scores were routinely two-thirds of historic UK general election scores – until 2017, when the Westminster result was more than comparable for the first time.
Figure 2: The deviation from proportionality (DV score) of British AMS elections
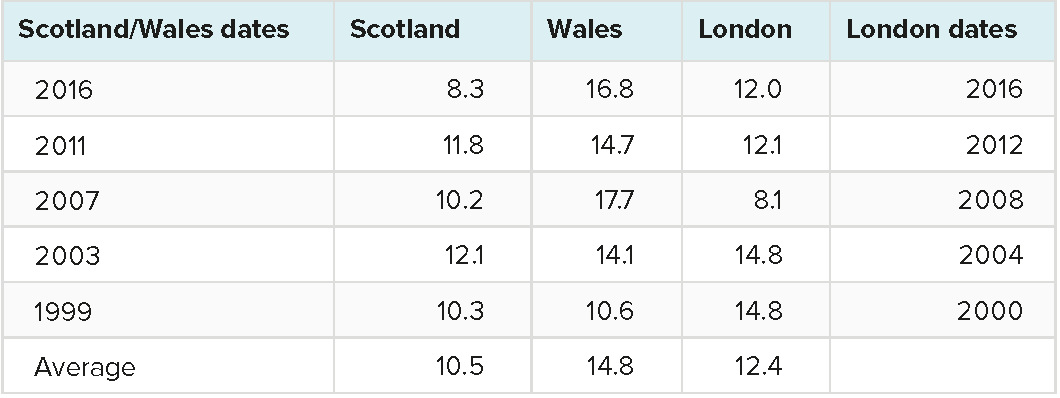
Note: The DV score shows the percent of representatives not entitled to their seats in terms of their party’s share of the overall vote. Its practical minimum level is around 5%.
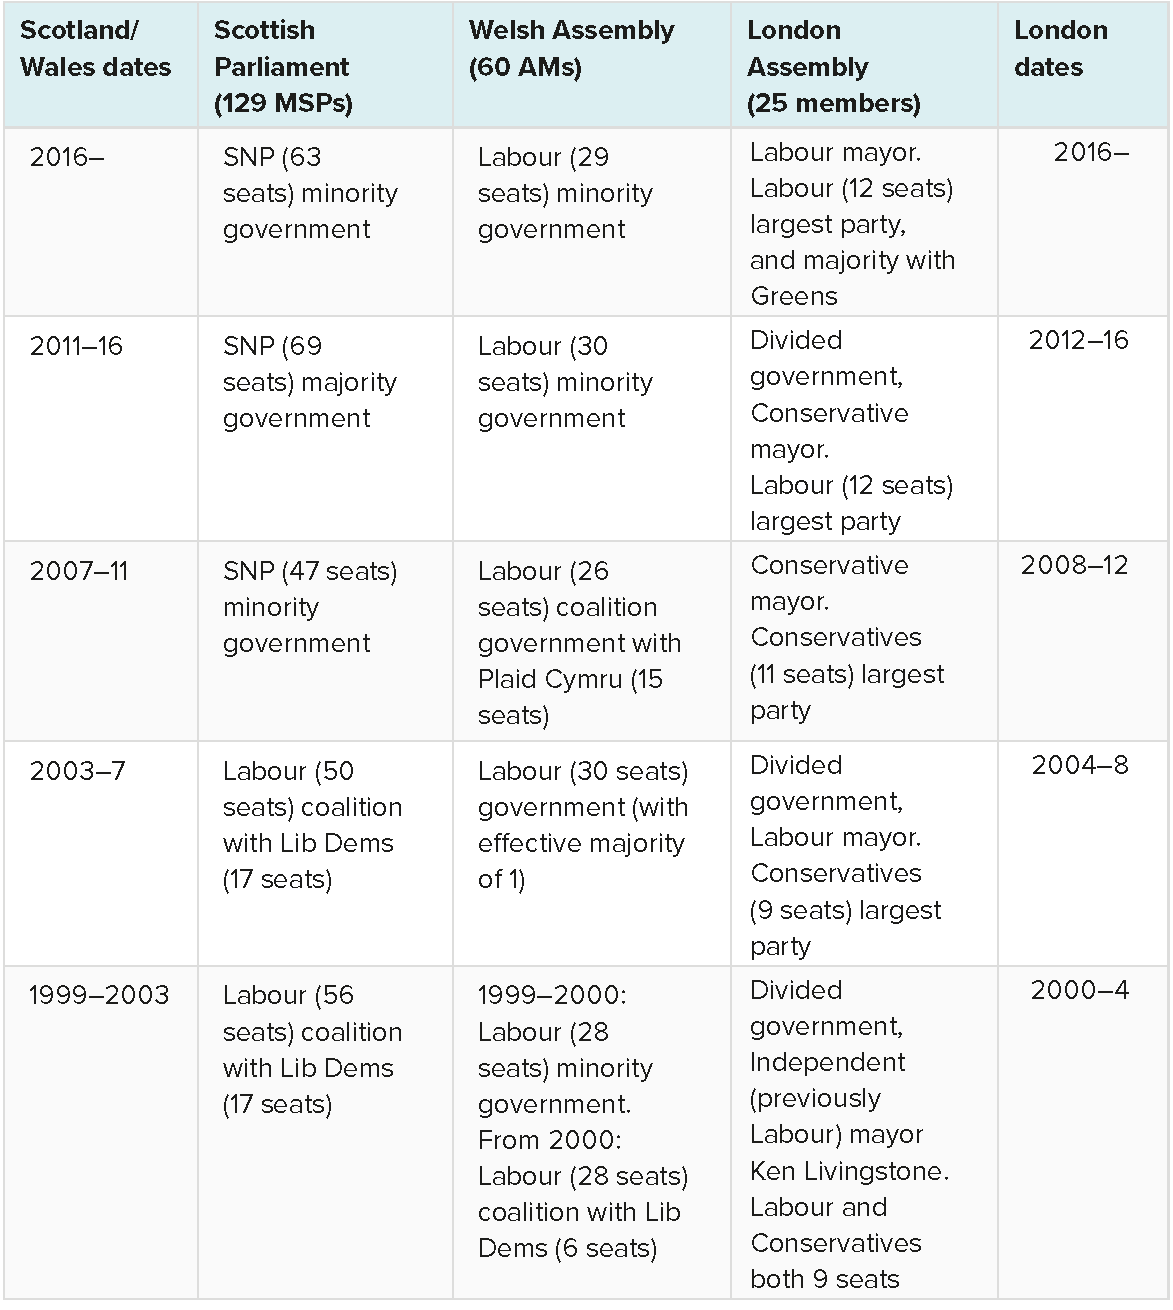
Proportional voting systems tend to produce coalition or minority governments, unless a single party can command a clear majority of seats on its own. Figure 3 shows that the AMS systems have only delivered one single-party government outcome: when the SNP won an outright majority in the Edinburgh Parliament in 2011. This was preceded by a period when the SNP ran a minority government (2007–11), a situation that returned from May 2016 onwards. In Wales Labour has been continuously in government since 1999, but has never had an outright majority. In London, mayors have always needed multi-party support in the Greater London Assembly, although the mayor’s strong powers mean that they can almost always get what they want done. In 2016 Labour won the mayor’s role and nearly had a GLA majority, but still needed Green support. In all three bodies the arrangements for forming governments (and ‘administrations’ in London) have always operated well, without prolonged uncertainty and with party divisions generally not being rancorous.
Figure 3: Governing outcomes of the additional member system elections
Strengths, Weaknesses, Opportunities, Threats (SWOT) analysis
| Current strengths | Current weaknesses |
|---|---|
| The AMS systems were purpose-designed for all three bodies. The Edinburgh system was defined by a constitutional convention and the GLA system by political scientist consultants. The Cardiff arrangements, however, were a political ‘fix’ decided by the Welsh Labour Party. | We noted above the shortage of top-up seats in Wales, which explains higher DV scores here, especially in strong Labour years. In London the Assembly has only 25 members, so every seat-switch between parties reallocates 4% of the total. So this is not a ‘fine-grain’ measure of party support. |
| It is simple for citizens to vote for a local representative. Some critics predicted that citizens would see constituency voting under AMS as more important than top-up votes. | In the London elections (2000) one in six voters did not use their second (‘top-up’ list) Assembly vote. However, by 2008, 2012 and 2016 more people voted in the top-up election than in the constituency stage. |
| Election results for all three bodies have historically been more proportional than for Westminster elections (see above). | The London Assembly's disproportionality (DV) score is also raised because by law no party can win a top-up seat unless they get 5% of the London-wide (list) vote. |
| AMS is easy to count, and it is straightforward for voters to understand how the overall result happened at both the constituency and list elections. All outcomes have had high levels of public acceptance and legitimacy. | The detailed counting rule used to allocate list or ‘top-up’ seats (called the d’Hondt rule) somewhat favours the one or two largest parties in all three areas. As in any electoral system, votes going to very small parties (below say 3% of the total) are unlikely to secure any representation – and in London cannot do so. |
| Turnout levels have been highest in Scotland at 49–59%. Wales has averaged 43%. London turnout grew from 33% in 2000 to 45% in 2008 and 46% in 2016. | Critics of the ‘two classes’ of representatives under AMS argue that constituency members have more contact with people in their local area and respond to their problems more, whereas the representatives from top-up lists focus on party and committee work, and on introducing new legislation and policies. A 2018 study showed that top-up area representatives respond less to letters from constituents. But the authors caution that why people write will likely differ. Constituency representatives may get more letters about constituents’ individual problems or issues that need a reply, while top-up area representatives may get more ‘political’ or general policy letters. |
| Under AMS, parties have incentives to put equal numbers of men and women on their top-up lists. Historically somewhat more representatives are women than in the Commons, with 35% of the Scottish Parliament, 36% of the London Assembly and 40% of Welsh National Assembly female members. But in 2017 Westminster began to catch up. | Outside London, the systems do not seem to have improved the representation of ethnic minorities or of people from manual backgrounds. |
| Future opportunities | Future threats |
|---|---|
| There are some reform demands to create more top-up members in the Welsh National Assembly. Such a change is likely to make seats results more proportional to votes cast. | Both Scotland and Wales are unicameral legislatures, so there is no upper house to constrain the behaviour of a party that becomes dominant there. |
| Over the 18 years it has been operating, the Scottish Parliament has gained far greater autonomy over more public spending and attracted high levels of public trust. Wales and Greater London are also pressing Whitehall for an increase in powers, and they have broad public support for such a change in their areas. | Critics argued in 2015 that the SNP had emerged as a ‘dominant party’ in Scotland, especially since the 2014 referendum, with adverse consequences for government responsiveness. There have been complaints of overly strong/unchecked executive rule by the party. However, 2016 saw a revival in the Conservative vote north of the border. And in 2017 the SNP’s hegemony over Westminster seats in Scotland proved short-lived. In Scottish Parliament elections there are no ‘electoral desert’ areas without multi-party representation. No democratic electoral system can ensure a greater diversity of parties than citizens have voted for. |
| As these bodies become more significant and permanent in the eyes of citizens, voters’ interest, turnout levels and media coverage may all increase, especially in Scotland. |
The supplementary vote for electing executive mayors and police commissioners
Used for: choosing the mayor of London; six new metropolitan or regional executive mayors in other English regions; executive mayors in 16 English local authorities, mainly large cities; and choosing all police and crime commissioners (PCCs) in England and Wales. From 2017 onwards SV has also been used to elect ‘regional’ executive mayors in six major areas outside London.
How it works: No voting system for a single powerful office (such as a mayor, governor or president) can operate in a proportional way, because the position involved cannot be divided between several parties. Instead the supplementary vote system tries to involve as many voters as possible in deciding who becomes the winner.
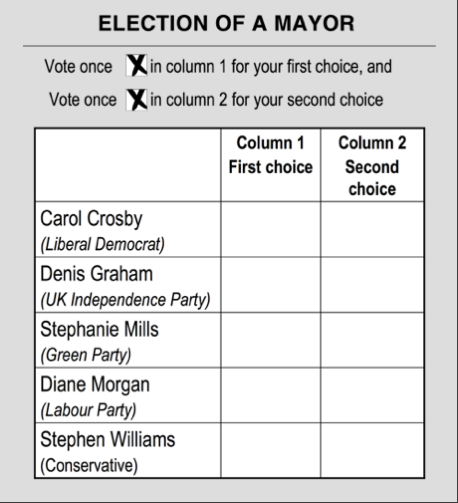
Voters have a ballot paper with two columns on it, one for their first choice and one for their second choice (see Figure 4). They put an X vote against their chosen candidate in the first preference column, and then (if they wish) an X also in the second preference column.
Figure 4: Example ballot paper for a mayoral election using supplementary vote
The key difference between the SV and FPTP systems is what candidates must do to get elected, as the system is designed to make leading candidates ‘reach out’ to voters outside their own party’s supporters to attract their second preference votes. Initially, only first preference votes are counted. If anyone has more than 50% at this stage then they are elected straightaway, and counting ends.
However, if no one has overall majority support, then the top two candidates go into a run-off stage on their own. All other candidates are knocked out of the race at the same time, and the second preference ballot papers of their voters are checked. Second choice votes for one of the two candidates still in the race are added to their piles. Once all relevant second votes are added in, whoever of the two top candidates has the most votes overall is the winner.
This process of knocking out all the low-ranked candidates at once, and redistributing their voters’ second choices, ensures that the largest feasible number of votes count in deciding who is elected. The person elected can only be one of the initial top two runners (unlike the alternative vote system, rejected at the 2011 referendum). And yet in practical terms they always have a majority of eligible votes cast. In repeated London elections, the winner has gained nearly three-fifths support.
Recent developments
The supplementary vote has been used to elect the London mayor since 2000, in numerous contests for other local mayors, for six new metropolitan/regional executive mayors outside London in 2017 and 2018, and in the 2012 and 2016 elections of police and crime commissioners. The London mayoral election has shown voters (and parties) learning how to use the SV system more effectively over time. Figure 5 shows that by 2016 nearly nine in ten voters took the opportunity to give both a first and a second preference vote. The same proportion of voters played a part in shaping the outcome, so that ‘effective’ votes rose from 78% in the first election to around 90% in the last three contexts. The number of second choice votes given to the top two candidates has remained steady. Nonetheless the share of voters endorsing only a third or lower placed candidate has fallen, and Figure 5 shows that most of these people may have good reasons for casting an ‘ineffective’ vote – such as signalling two preferences for less popular parties in order to boost their future chances. Turnout levels in London also rose over time, from just over a third in 2000 to above 45% in 2008 and again in 2016.
Figure 5: London mayoral elections using the supplementary vote, 2000–16
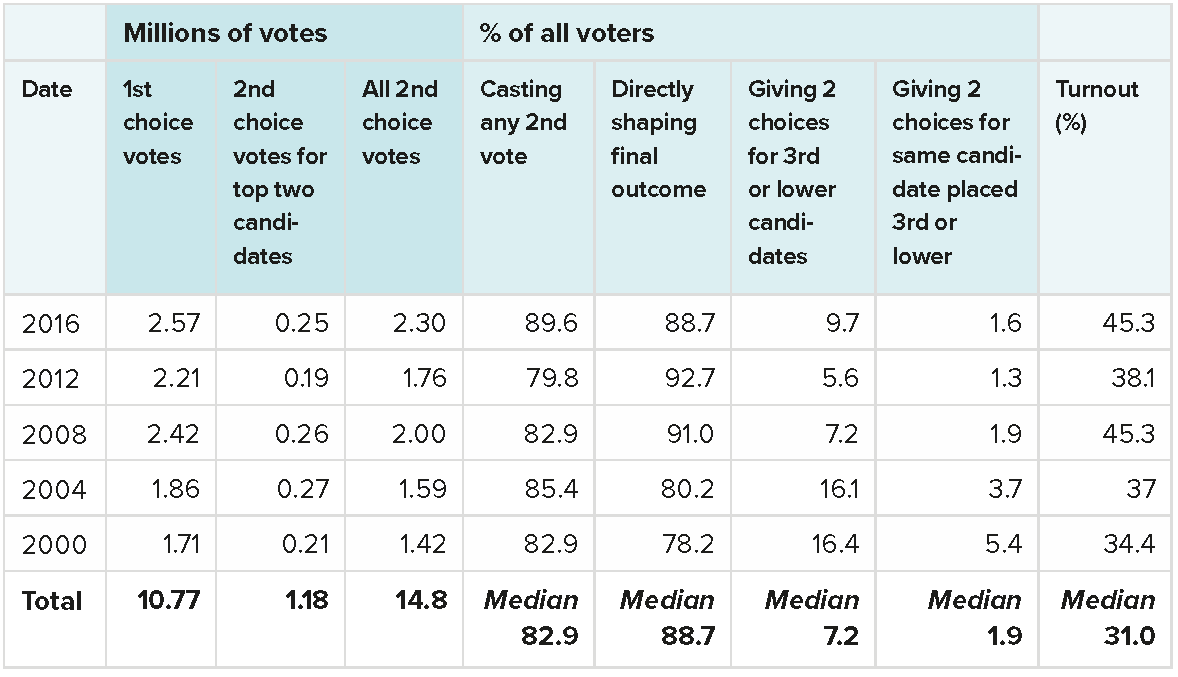
Source: Computed from Greater London Authority, various dates.
Notes: Votes shaping the final outcome are defined as the combined total of first and second choice votes for the top two candidates (those in the run-off stage).
The London mayor system has been very effective in giving unchallenged electoral legitimacy to five winners in a row (each of whom has ended up with roughly 60% of final counted votes). The model has inspired its imitation elsewhere as a key part of English devolution. Following deals negotiated between council leaders in seven areas and Conservative ministers to decentralise some Whitehall powers, new ‘metropolitan or regional mayor’ SV elections were set up and elected in 2017 in Greater Manchester (where the mayor controls health service and infrastructure spending), the West Midlands, the Liverpool City Region, Cambridge/Peterborough and the West of England. Another followed in Sheffield City Region (which covers Rotherham, Barnsley and Doncaster) in 2018, attracting interest despite the role of the metro mayor not being finally defined by the election date. Further elections may follow if proposals for a whole-of Yorkshire regional mayor progress.
Figure 6 shows that turnout levels were lower than with other SV elections, but this is normal the first time a contest is held, before any institutions have started operating or policies have been implemented.
Figure 6 also shows that outside London there has been a limited trend for some major cities and some towns to adopt the executive mayor system (like Watford, Bristol, Liverpool and Leicester). Elections there have generally operated in far more diverse ways. Figure 6 shows that in 16 out of 36 SV contests in conventional local authorities, one candidate won outright with clear majorities at the first-preference vote stage, so that second votes did not need to be counted. This pattern reflects a strong tendency for SV elections to be adopted in ‘safe’ Labour city or town areas, and areas with strong Liberal Democrat or ‘other’ voting (including some early support for independent candidates, which has decreased over time). As with the new regional/metro mayors, Figure 6 shows that the proportion of voters shaping elections (by casting either a first or second vote for one of the top two candidates) has generally been high in conventional local mayor contests, even when only a single count has taken place.
Finally, two rounds of police and crime commissioner (PCC) elections have also been held using the SV system. In 2012 these were poorly planned. They were held unexpectedly in November, at a cold time of year, with little advertising and separate from normal local elections – resulting in just a 15% turnout. There was little publicity about what the 40 new commissioners would do, or who the candidates were. And, of course, most voters outside London were using SV for the first time. Yet, even so, one in seven voters cast a second preference, nearly 71% of votes shaped the final outcome, and the results were accepted as a sound reflection of the views of those voting.
In 2016, the PCC elections were held at the same time as conventional local authority elections, and consequently turnout improved significantly. However, the number of voters casting second preference votes increased slightly to just over one in six. And second time around 83% of votes were cast for top two candidates across both rounds of voting. Only three areas returned (Labour) PCCs on the first round alone.
Figure 6: Recent major elections in England and Wales using SV, 2009–18
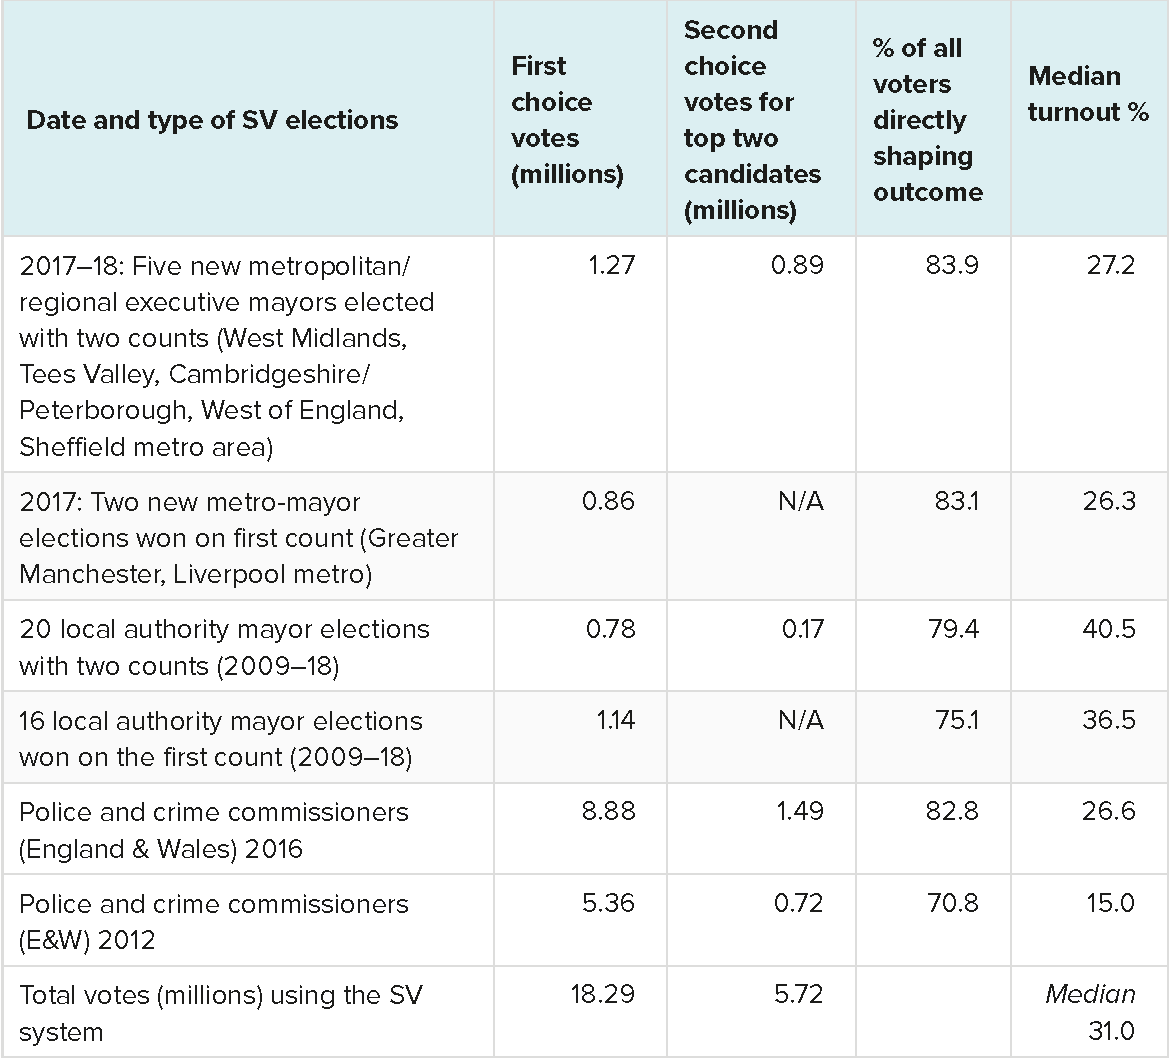
Source: Computed from House of Commons Library, ‘Local Election Reports’, various dates; and ‘Police Commissioner Elections 2016’, and 2012.
Notes: Votes shaping the final outcome are defined as the combined total of first and second choice votes for the top two candidates (those in the run-off stage). Where a candidate wins on first choices alone, then only the top two candidates’ first choices are counted.
Strengths, Weaknesses, Opportunities, Threats (SWOT) analysis
| Current strengths | Current weaknesses |
|---|---|
| The supplementary vote (SV) was a novel system when introduced first in London in 2000, following recommendations by political scientist consultants. The system is now well-established and has proved popular with voters. | Some critics have argued that the person chosen may not quite have a majority of all the votes cast. This is because some people may give both their first and second choice votes to smaller party candidates, who stand no chance of being in the final top two run-off (see Figures 5 and 6). But then no other voting system for a single office holder can guarantee to achieve this elusive ‘majority’ in practice either. |
| The SV system is simple for voters to use. Supporters of smaller parties can express their real feelings with their first vote, but still use their second vote to choose which of the top two candidates they prefer to win. | SV is like an ‘instant run-off’ version of double-ballot elections (used for example in France, where if no one gets a majority on the first ballot, voters must come back a week later and vote again). Some critics argue that it is hard for voters to know in advance who the top two candidates are likely to be. But in London and most local areas this should be reasonably clear. |
| SV is straightforward to count, even at large scale – around two million votes are counted overnight in the London-wide mayoral contest, using electronic counting. Voters can easily understand how the count operated and how the result happened. | While the metropolitan/regional executive mayors were required by the Cameron government before they would devolve powers, English local authorities have had the free choice to introduce executive mayors or not since 2000. Now 23 cities, towns, London boroughs and regional/metro mayors use this system. In a few areas executive mayors were elected for a time but then abandoned following local referenda. In a larger number of council areas voters in the 2000s turned down executive mayors in local referenda. |
| Election results for the London mayor have shown the run-off winners getting nearly 60% of all eligible and counted votes. All five results have been accepted as accurate, giving incumbents of the office very high levels of public acceptance and legitimacy, both within London and in national (and indeed global) politics. | One or two early mayoral elections saw victories for unlikely or allegedly ‘joke’ candidates with high name recognition. This pattern has now died out, with partisan candidates prominent in most competitions, but with some conventional independents also, especially in Labour-dominated areas. |
| Recent turnout levels for the London mayoral elections at 40–45% are quite high for local elections. |
| Future opportunities | Future threats |
|---|---|
| The extension of SV to the new regional and metro mayors has worked well, and broadened English voters’ experience of the system. | The Conservative election manifesto in 2017 suddenly proposed to scrap SV for all mayoral and police commissioner elections and revert instead to plurality rule (first-past-the-post). Following the Conservatives’ disastrous election set back and a hung parliament, this position has been formally reiterated once, but no action currently seems likely. |
| Turnout for police commissioner elections improved significantly in 2016, when they were run alongside local elections. This again may boost public awareness of SV. | Some local authorities with an executive mayor may still revert back to a council system after a local referendum. But again this is normally for wider political reasons, and not because of dissatisfaction with SV. |
| Some local authorities without elected executive mayors may adopt them in future. |
Is the supplementary vote threatened?
Despite the spread of the SV system, and the fact that more than 29 million English voters have used it successfully since 2000, the Conservative election manifesto for the snap 2017 general election pledged to scrap the supplementary vote for all mayoral and police commissioner elections. Drafted by Theresa May’s advisors, and coming somewhat ‘out of the blue’, a short clause proposed that standard plurality rule voting (first-past-the-post) would be used instead. Following the Conservatives’ failure to win the general election, and a hung parliament, this position was reiterated once by Sajid Javid when he had responsibility for local government. However, no further proposal to make any change has followed.
It seems unlikely that a change of this overtly partisan kind, made in one party’s interests, could progress through both Houses of Parliament before another general election. The proposed change might require referenda also, since the London and metro mayors (including how they were to be elected) were all approved first by regional referenda. It is also unclear why the May government should seek to reverse the Cameron government’s stance, or whether the policy is still ‘live’. No rationale was given, except for the claim that plurality rule was ‘simpler’ for voters.
Reverting to plurality-rule elections now, for purely partisan interest reasons, would be a highly destructive institutional change. It could dramatically lower the cross-party legitimacy of elected mayors, which has been key to their success in framing broadly supported policies for their cities. In almost all UK urban settings (except Liverpool) under plurality elections the winning mayoral candidate would lack majority support. And in a multi-party election, winners might be elected with quite low levels of support (30% or less), as has frequently happened in US mayoral elections and elections for the Japanese regional governors.
Of course, no voting system is perfect. SV obviously works better when voters can accurately identify who the top two candidates are in advance, so as to use their second preference vote effectively, if they wish to – as in London, the new metro mayor contests and in local authorities with previous experience of SV. If a voter does not use either of their preferences for one of the top two candidates then their input does not determine who wins. But many voters who choose to support two ‘no hope’ candidates may well do so deliberately – for example, seeking to signal their strongly held preferences or ideological views, rather than to shape the election outcome at the run-off stage. There are no grounds on which political scientists can validly class this as ‘ineffective’ voting, since it is a perfectly rational choice. The only genuinely ‘irrational’ pattern might be if people vote twice for the same ‘no hope’ candidate (who comes third or lower). Figure 5 (above) showed that one in 20 Londoners did this in 2000 – but that level has now fallen below one in 50.
Conclusions
All three additional member systems have operated effectively and the electoral legitimacy of governments in Scotland and Wales has been high. Furthermore, the representativeness of the Scottish Parliament and Welsh National Assembly has not been questioned by the public or the media. In London the Assembly elections have been seen as fair, and its scrutiny role has secured some public profile in holding to account the powerful executive mayor.
The supplementary vote system has also proved successful, working very effectively in London in elections so far, and because of that also spreading out to shape the choice of more directly elected public officials in England, with a high degree of non-partisan support. With more than 29 million votes having been successfully cast in this way, SV is a rare case of a reformed electoral system expanding incrementally to new bodies and policy areas, under governments of both the main parties.
An early version of this article was originally published on 17 July 2018. Substantial revisions, in particular to the figures, were made on 17 October 2018. This later version is an extract from our forthcoming book, The UK’s Changing Democracy: The 2018 Democratic Audit, published by LSE Press.
About the author
Patrick Dunleavy is Professor of Political Science and Public Policy at the LSE, co-director of Democratic Audit and Chair of the Public Policy Group.



 Democratic Audit's core funding is provided by the Joseph Rowntree Charitable Trust. Additional funding is provided by the London School of Economics.
You define democracy from line one as: “It should accurately translate parties’ votes into seats” That is actually the balance of power in a party oligarchy.
“the representativeness of the Scottish Parliament and Welsh National Assembly has not been questioned by the public or the media.”
The Richard report denounced AMS as denying the voters the fundamental democratic right to reject candidates. The subsequent McAllister report, for the Welsh parliament, also recommended that AMS be replaced by the Single Transferable Vote.
The first convenor of the Scottish parliament, David Steel, also criticised the “democratic deficit” of AMS, and urged its replacement by STV.
Two former Scottish First Ministers have also drawn attention to the undesirability of all MSPs not being proortionally elected, and of some party list Members having “jobs for life”.
John Stuart Mill: Proportional Representation is Personal Representation.
The Angels Weep: H. G. Wells on Electoral Reform.
Richard Lung:
Peace-making Power-sharing;
Scientific Method of Elections.
Science is Ethics as Electics.
FAB STV: Four Averages Binomial Single Transferable Vote.
(in French) Modele Scientifique du Proces Electoral.
[…] An updated, 2018 edition of this article is now available here. […]