England’s local elections 2019: council outcomes from ‘no overall control’ results
With the two main parties losing hundreds of council seats, and the Lib Dems, Greens and Independents gaining across England in May’s local elections, the number of councils where no single party had a majority increased in 2019. In the first of two articles, Chris Game details how this has shaped governing outcomes for English councils – and demonstrates why reporting political coalitions in local government matters.
An election count. Picture: Coventry City Council/(CC BY-NC-ND 2.0) licence
On 31 July the House of Commons Library published one of its invariably useful and regularly indispensable research briefings, its 40th this year alone qualifying for inclusion under the topic of elections. This one analysed ‘the results of the local elections held in England and Northern Ireland on 2 May 2019’ (House of Commons Library, 2019) – somewhat belatedly, it’s true, even allowing for the inclusion of an interactive map of England on the Commons website.
It was that map, though, (reproduced below) that finally prompted me to write this article, the first of two linked blogposts, protesting to the world at large, but particularly to councils themselves, that RESULTS, particularly of local elections, however colourfully and interactively presented, are not necessarily the same as OUTCOMES. Moreover, when they’re not, it is the outcomes that are ultimately more important and, as I hope to illustrate, more interesting.
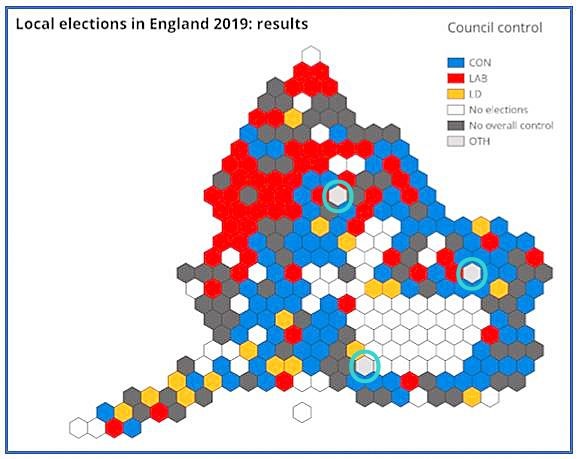
Source: House of Commons library
For the sake of those whose memories, like mine, aren’t what they were, I’ll start with a headline summary of this year’s results, which involved elections to councils where all or one-third of seats were previously contested in 2015. Conservatives again won the most seats (3,559), but lost over 1,300 and with them control of 55 of the 198 English councils they had previously held, the current 143 being their lowest total in over 15 years. Labour won 2,020 seats, and also lost more councils than they gained, reducing their total to 91, their lowest since 2012. Liberal Democrats won 1,351 seats, more than doubling their councillor numbers and increasing their councils controlled to 23, the highest since their pivotal year of 2010. Greens won 263 seats, this 3% being easily their highest figure this century. UKIP took 34 seats, 167 fewer than in 2015. Finally, virtually overlooked in the Commons briefing, but perhaps most remarkable, considering how almost all aspects of the electoral system are stacked against them, was the impact of the variegated so-called ‘Independents’ – who gained over 600 seats, and took control of the previously Conservative Uttlesford and Labour Ashfield councils, plus the Middlesbrough mayoralty.
Which returns us to the map. Uttlesford and Ashfield are there, in the vicinities of west Essex and Nottinghamshire, but their hexagons are shaded an inappropriate grey, along with Epsom & Ewell, perpetually (well, since 1937) controlled by its Residents Associations. They deserve something far more distinctive – hence the added aquamarine rings – and also more than a shared paragraph, but, as effectively majority party groups, they are not what this article is primarily about. I’d direct readers, though, to Wiki for ‘Residents Associations of Epsom and Ewell’ and ‘Residents for Uttlesford’, and for Ashfield just Google Council Leader ‘Jason Zadrozny’. The appropriately white or empty boxes are councils without elections in this year’s cycle – mostly the London boroughs, where all-out elections were last year, and councils undergoing or having undergone ‘re-sizing’ by the Local Government Boundary Commission.
This leaves us with the profusion of dark grey hexagons, labelled ‘no overall control’. There are 79 of them in this count, which includes elected mayoral councils and those with so-called ‘alternative governance arrangements’, both of which groups are excluded from the main table below. However counted, though, and while admittedly far fewer than in the noughties when the Lib Dems were regularly winning a quarter of the vote, there were still, as July passed into August, one one in every four or five councils appearing under the description ‘no overall control’ (NOC), indicating that no single party has a majority of seats on the council.
It’s an unfortunate label in several ways. First, it’s much too close to, and certainly risks being interpreted as, ‘out of control’. Secondly, it carries (or at least did before Brexit) the suggestion that the narrowest single-party majority is somehow democratically superior to and operationally sounder than a necessarily negotiated partnership of two or more parties or groupings. Personally, I’d prefer CTBD – ‘control to be decided’.
Either way, it should be treated by all concerned – and particularly affected councils – as temporary. This in turn should at the minimum mean the council should communicate – along with individual ward results and the basic party arithmetic – that inter-party negotiations are in progress, and that final decisions will be taken at the council’s Annual Meeting later in the month, and then communicated publicly immediately afterwards. It’s hardly rocket science, but I assure you that the proportion of councils who manage it well remains disappointingly small.
This is why on several previous occasions I’ve attempted myself to tidy up these electoral loose ends and complete the picture (in 2014, and 2016). And it is why, particularly with all the talk of the party pacts and alliances that nationally might have got us somewhere over the past three years, and certainly would have saved the Westminster Parliament from being the laughing-stock of the EU, it seemed a good time to illustrate just how surprisingly creative local politicians can sometimes be when faced with potentially tricky post-election numbers.
Incidentally, by my unmeticulous reckoning, and including the New Democracy Party’s resounding victory over the Syriza-led coalition in July’s Greek elections, 18 of the 28 EU countries currently have coalition governments at the centre. Six of these comprise two parties, 11 three parties, and the Netherlands four. Four parties, four colours: Liberals blue; D66 (not a code or a road, just date of formation!) blue/green; Christians yellow; Orthodox Protestants orange. Almost a complete rainbow, and certainly nearer than most arrangements that can be almost guaranteed to produce ‘Rainbow Coalition’ headlines in the local press of any council when two or more party groups look like getting it together.
My purely personal ‘Rainbow Coalition’ definition, for the purposes of these blogs and particularly the accompanying table, is simple. However it might be presented by the participating party/non-party groups – more frequently nowadays as an ‘Alliance’, ‘Pact’, or even a ‘Together Group’ (you know who you are!) – if there is an explicit working agreement involving at least three distinct groups, that’s a Rainbow COALITION, if it totals 50% + 1 council seats, and a Rainbow coalition, if it doesn’t command a majority. Our closest example is, of course, the National Assembly of Wales, currently governed by Mark Drakeford’s Rainbow COALITION of Labour, a Liberal Democrat, and an Independent, representing 31 of the 60 Assembly seats.
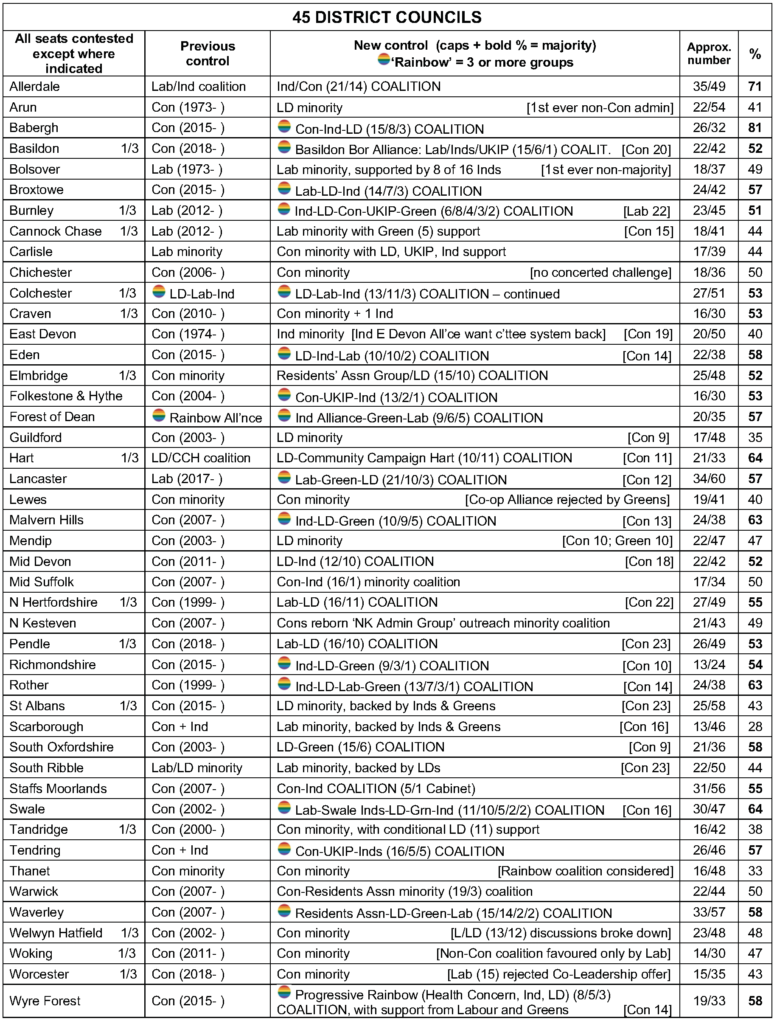
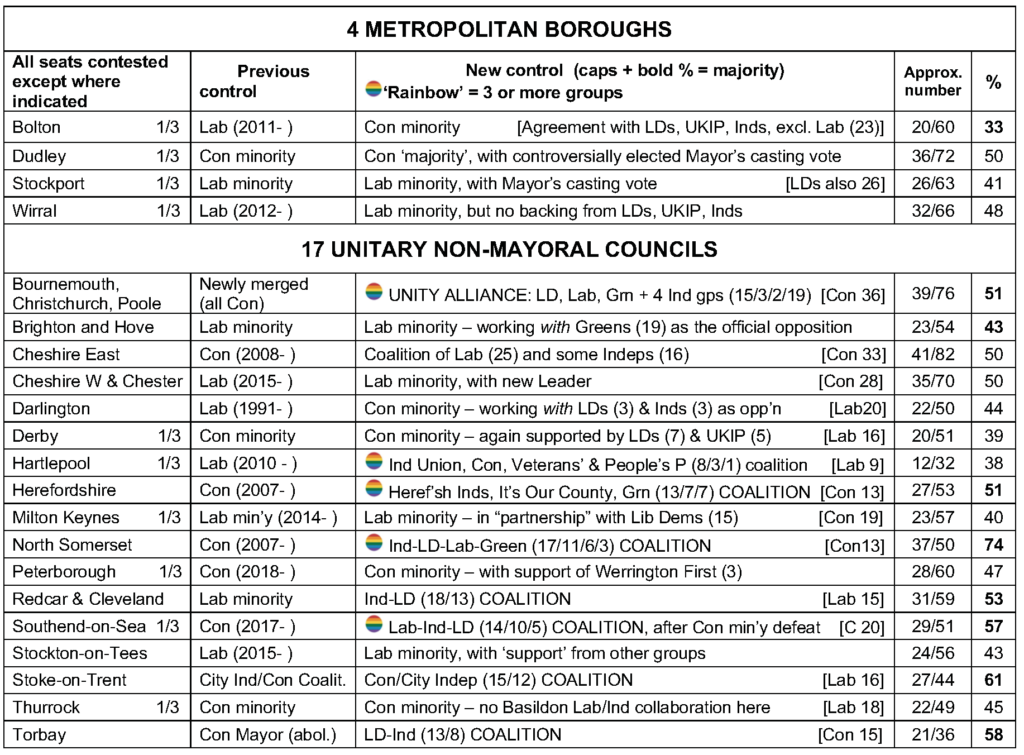
By my totally unofficial reckoning, there were 21 of these Rainbow arrangements negotiated in the weeks immediately following this May’s local elections – as set out in the accompanying table below. They will constitute the focus of the second of these two linked articles.
Results and outcomes of England’s May 2019 local elections
The results and outcomes listed below are for councils with ‘leader + cabinet’ executive arrangements, where seats were contested in May 2019, and no single party won over 50% of the seats and thereby immediate control of the council.
You can read Part 2 here: England’s local elections 2019: Part 2 – Rainbow and other coalitions
This post represents the views of the author and not those of Democratic Audit.
About the author

Chris Game is an Honorary Senior Lecturer at the Institute of Local Government Studies (INLOGOV) at the University of Birmingham.


 Democratic Audit's core funding is provided by the Joseph Rowntree Charitable Trust. Additional funding is provided by the London School of Economics.
A most timely and very welcome article that recognises both the significance and the potential for good community leadership among councils described as being in ‘no overall control’. More on these councils please! They will be fascinating to watch in the coming months and years as the politicians from different parties and groups, frequently with less than complete agreement on priorities, and probably with more than a few clashes of personality too, wrestle with the challenge of presenting themselves as unified and effective administrations, and of course, against a background of continuing financial austerity and heavily constrained ambitions.
“and certainly would have saved the Westminster Parliament from being the laughing-stock of the EU”
I wouldn’t be too worried about being a laughing-stock. I can live with a chaotic process that reflects the difficulty of responding to the result of the referendum; I have faith in parliament to struggle towards the light.
I enjoyed reading this piece about the very cusp of democracy.
It’s a simple fact that every one of us has our own set of values, attitudes and opinions. So a representative democracy has to reflect a whole range of opinions. If just a single party is in government, it is unlikely to be representative – and it’s not therefore democratic. So why, for so long, have we tolerated single parties telling us that single party rule is better government?
I look forward to the next piece.